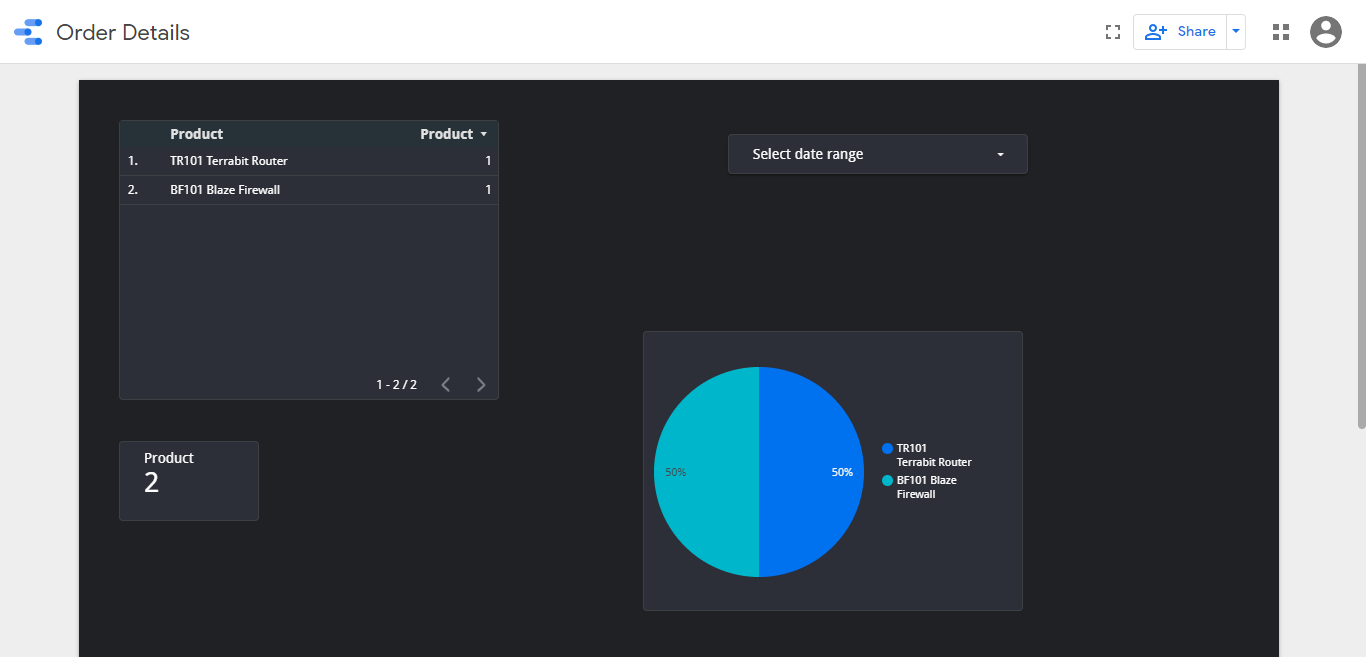
Create Report in Google Data Studio
Step 1. Enable External Analytics Connector
Before you create a template, you must enable the External Analytics Connector to get started.
-
Sign-in to your EFFORT account.
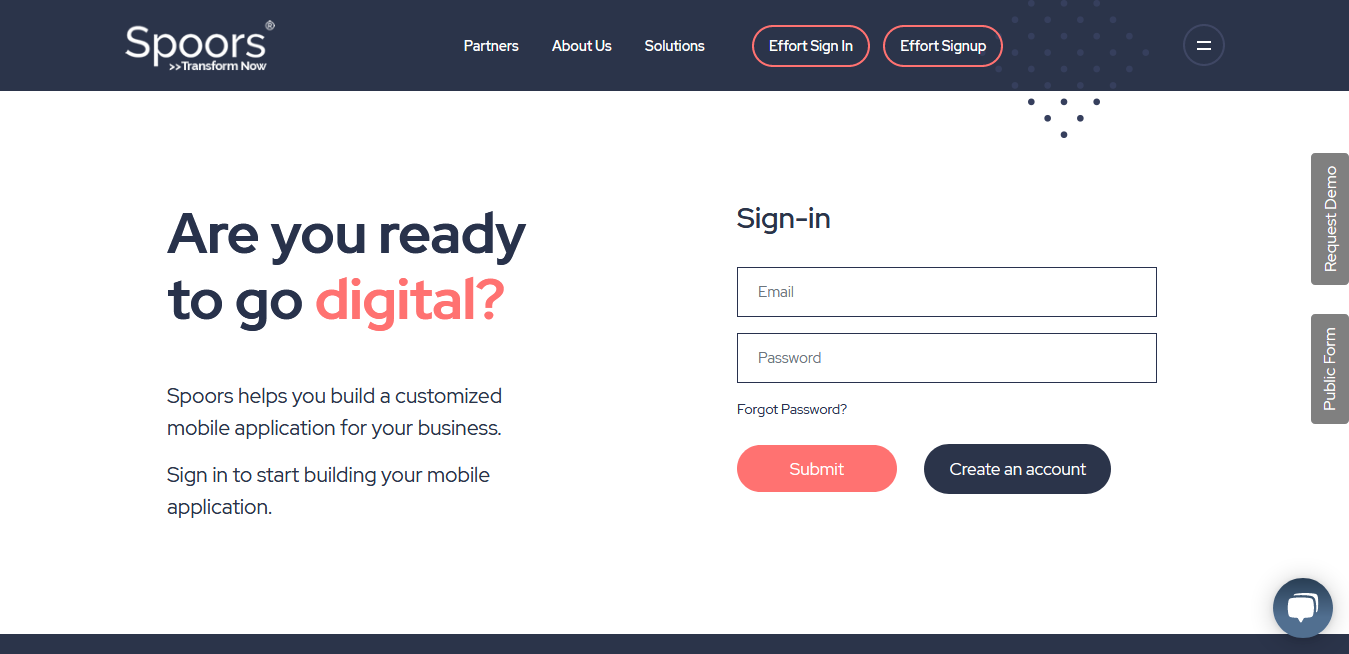
If you don't have an account with EFFORT, visithttps://secure.spoors.io/effortx/signup.
For more information, refer to Sign-up for an Account.
-
Go to .
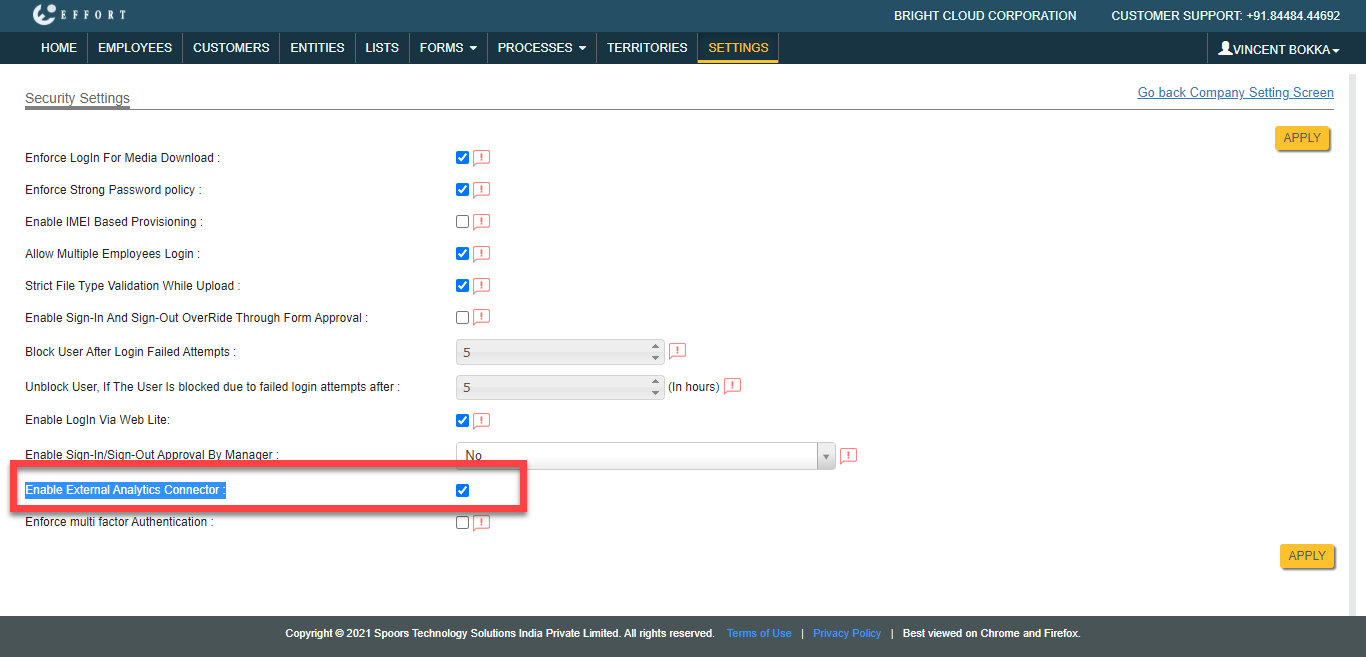
The Security Settings page appears.
-
Click Enable External Analytics Connector
checkbox.
-
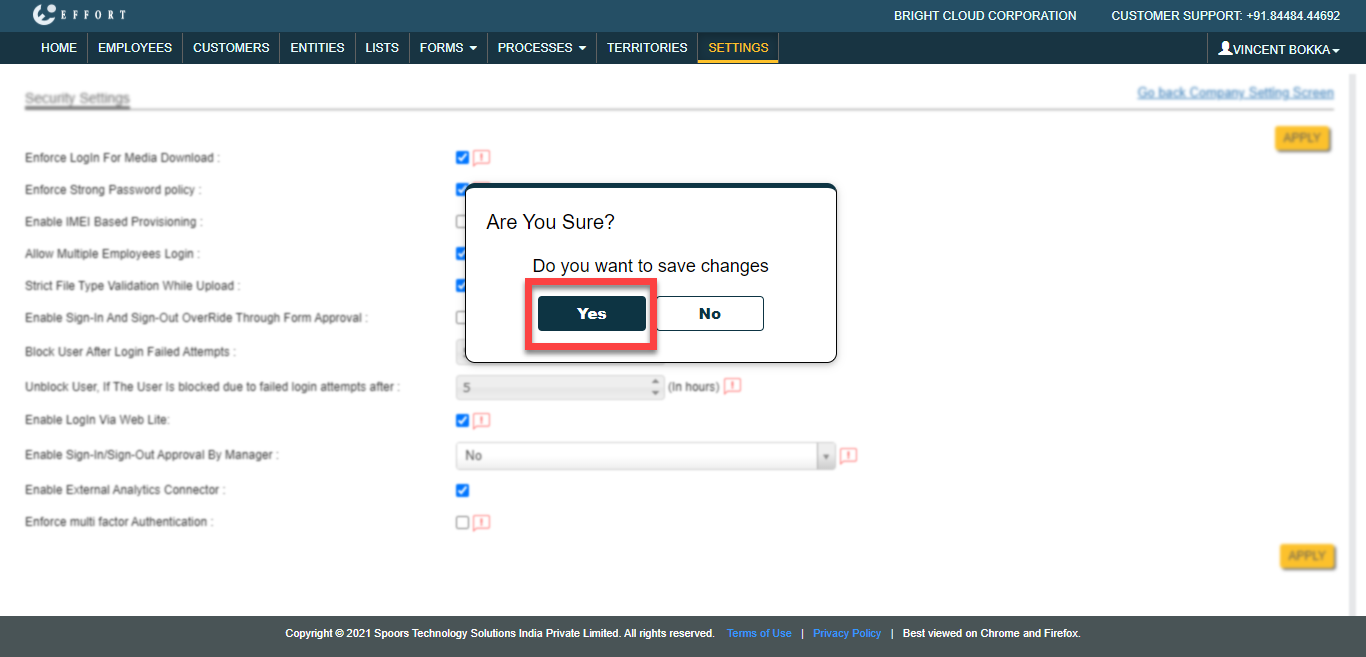
Click Apply and click Yes in
the confirmation pop-up.
-
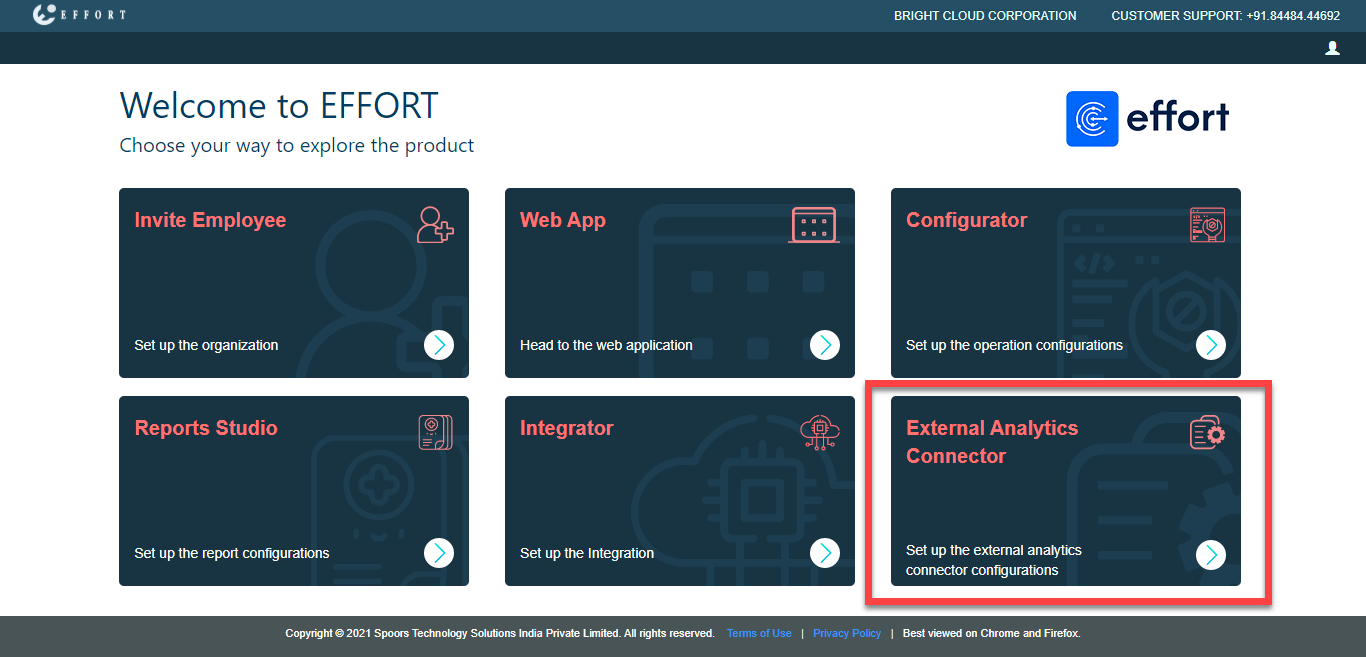
Now logout and login again to see the External Analytics
Connector card on the welcome page.
Step 2. Create a Data Delivery Template
Before you take a report, you must create a template in the EFFORT Google Data Studio module.
-
Click External Analytics Connector card on the
welcome screen.
-
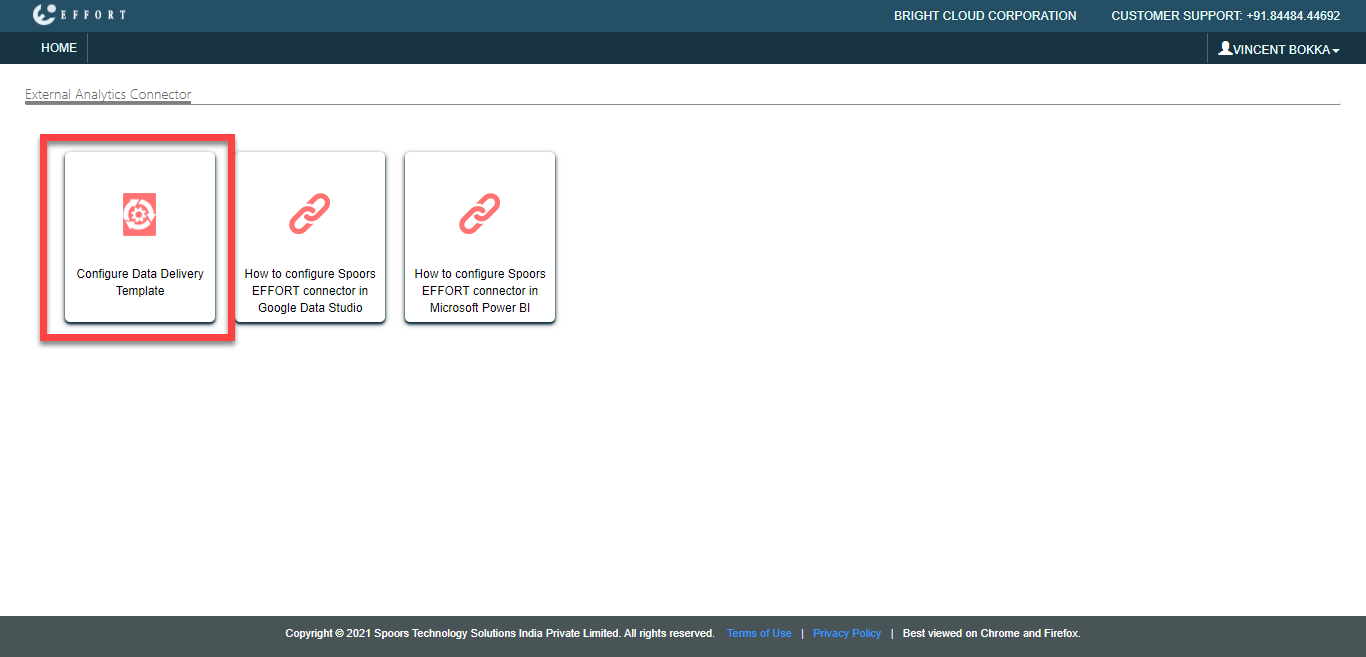
Click Configure Data Delivery Template card.
-
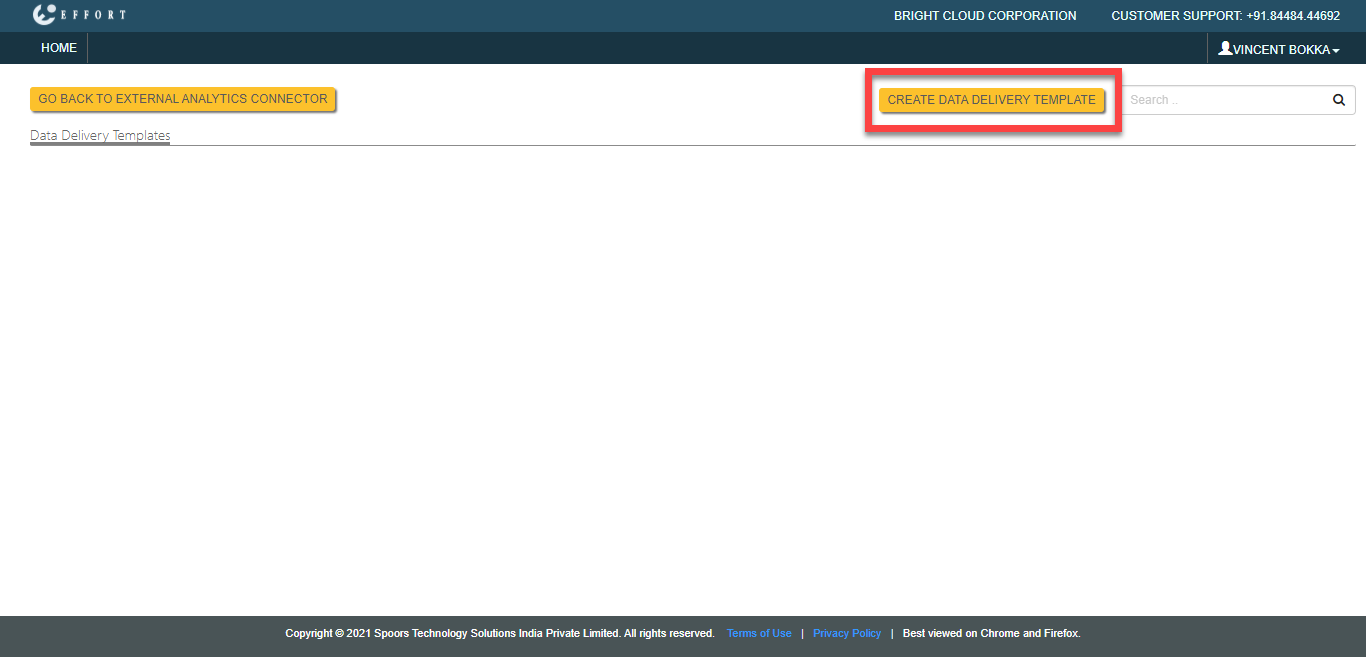
Click Create Data Delivery Template button.
-
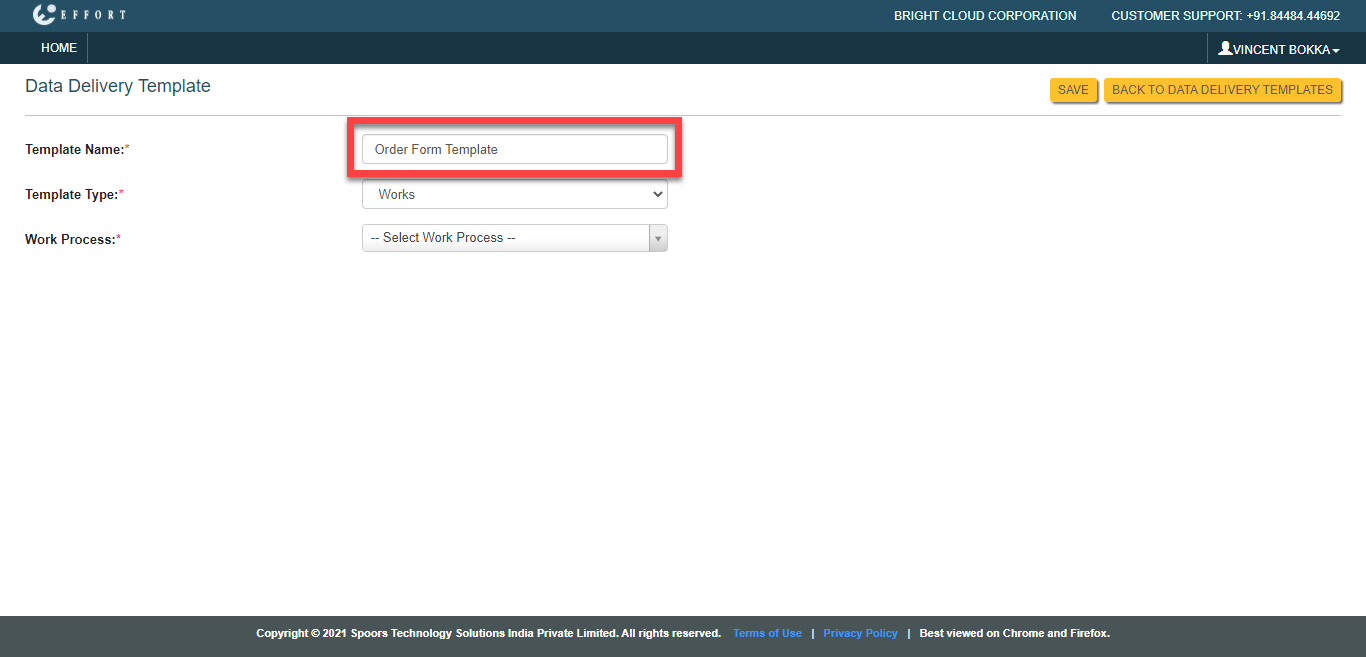
Enter a name for the template in the Template Name
textbox.
-
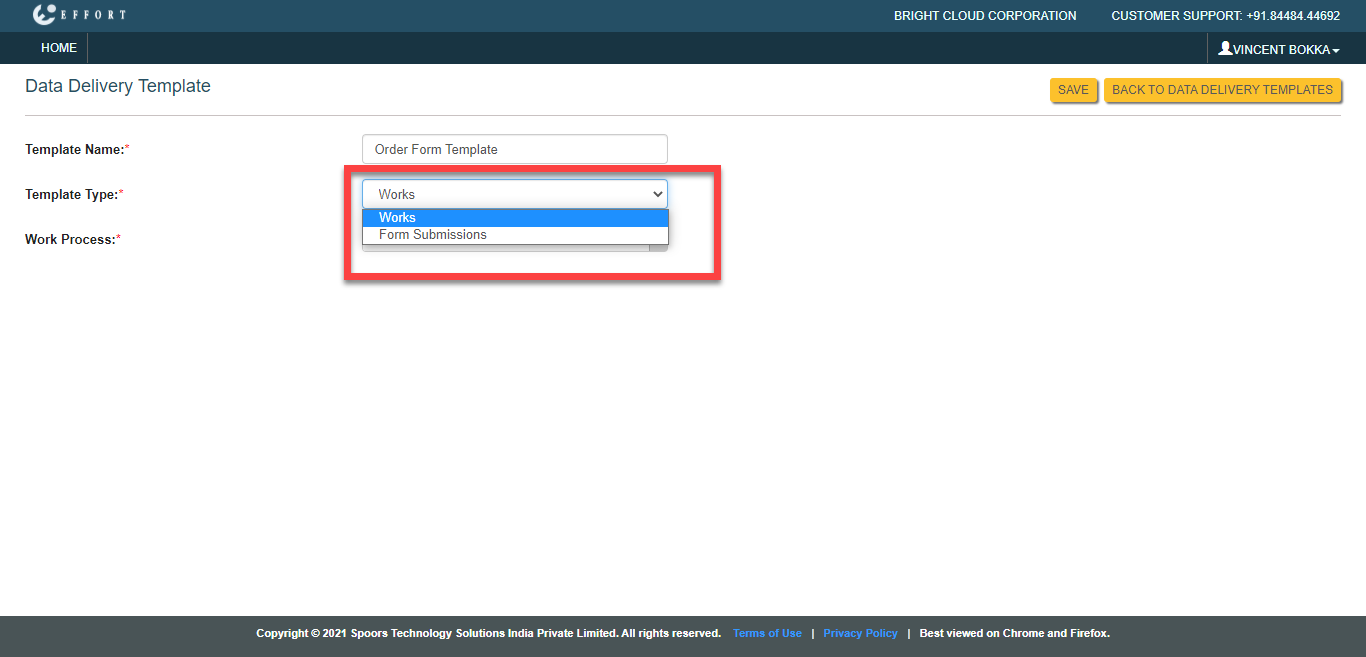
Select either Works or Form
Submissions from the Template Type
dropdown.
-
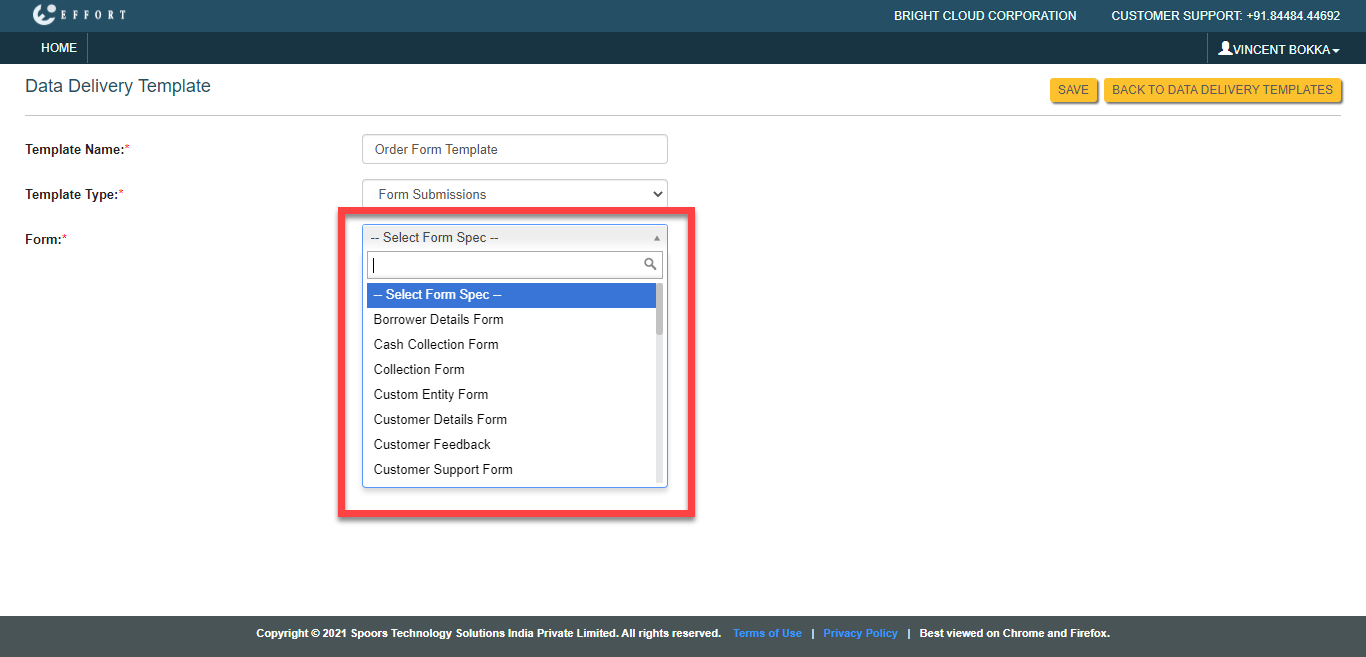
If you opted for the Forms Submissions as
Template Type, select a form spec from the
Form dropdown.
If you opted for the Works as Template Type, select a Work Process from the dropdown.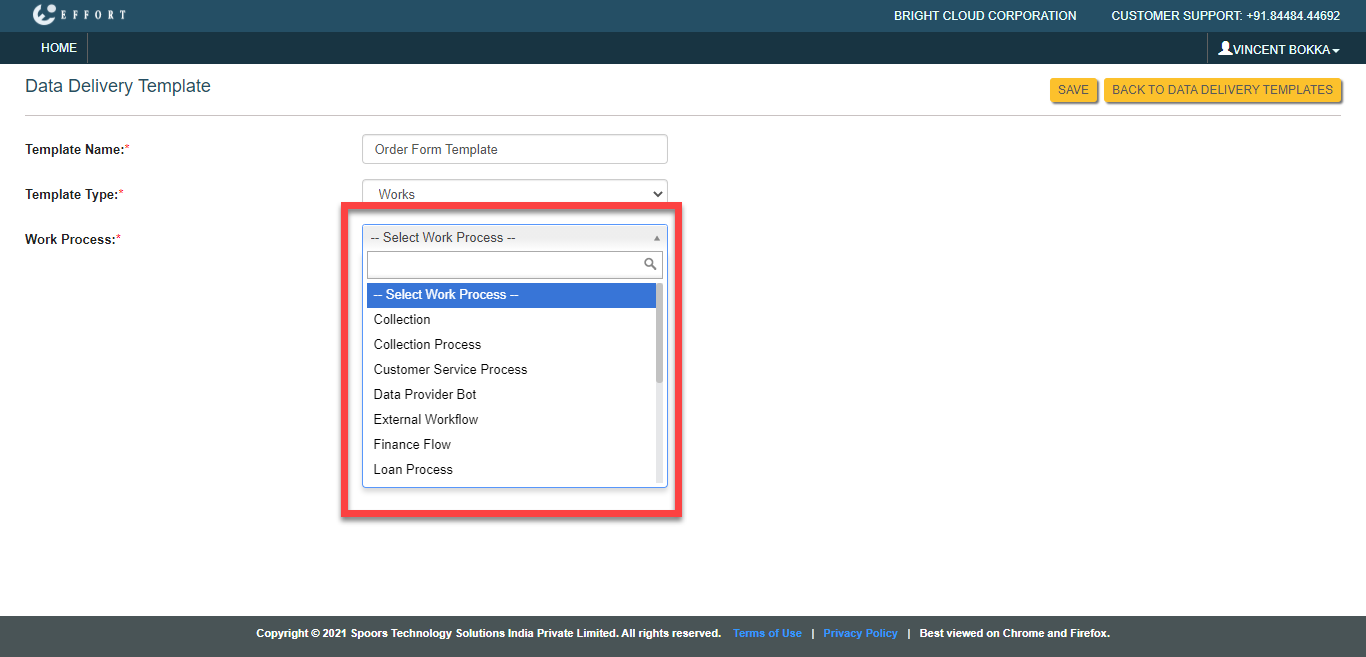
-
Click Add Cloumn button to add the
Fields.
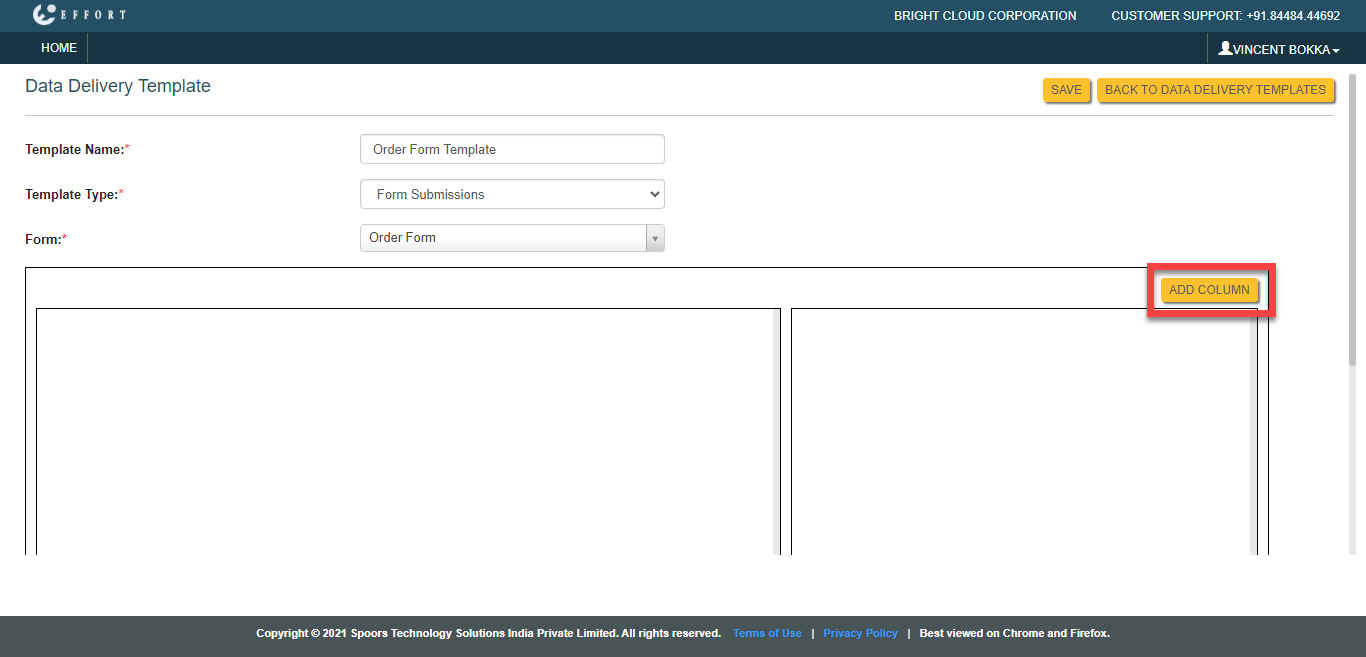
You can add more fields as per your requirement. -
Enter a name for the Field in the Column
Name textbox which is on the right-side section.
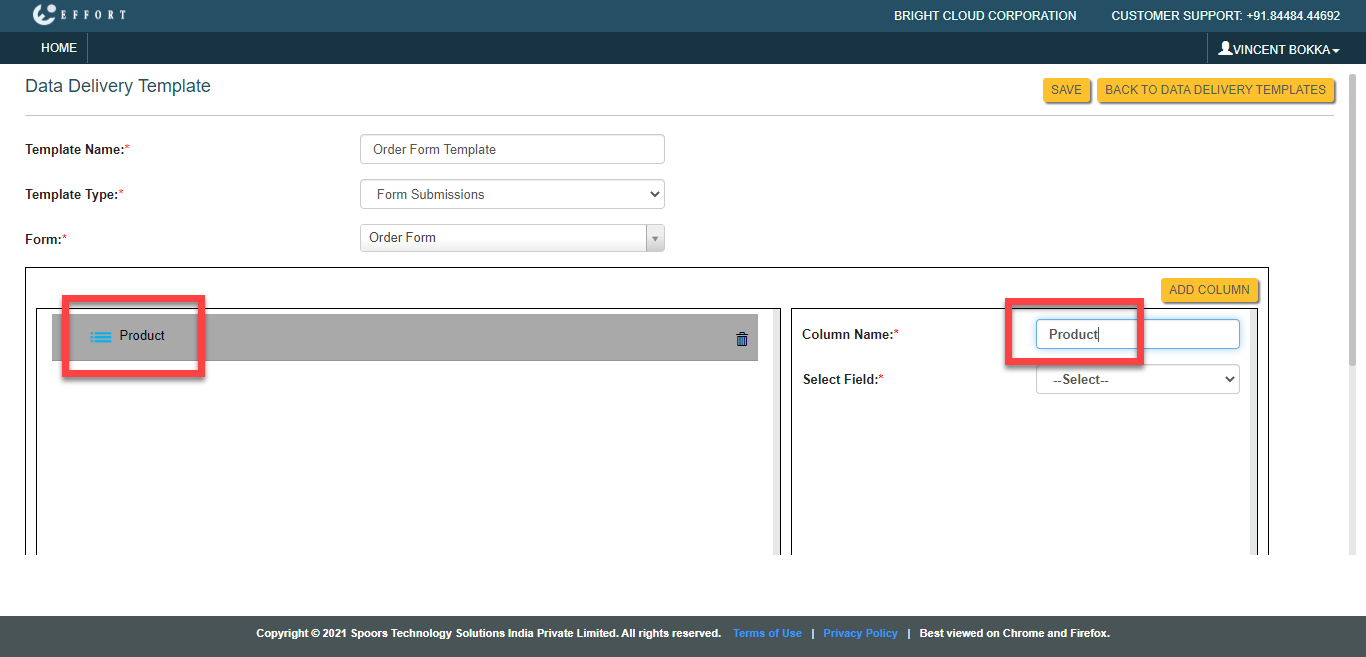
Note: Do not include spaces or any special characters in the Column Name. It will generate a system error when you create a report in the Google Data Studio. -
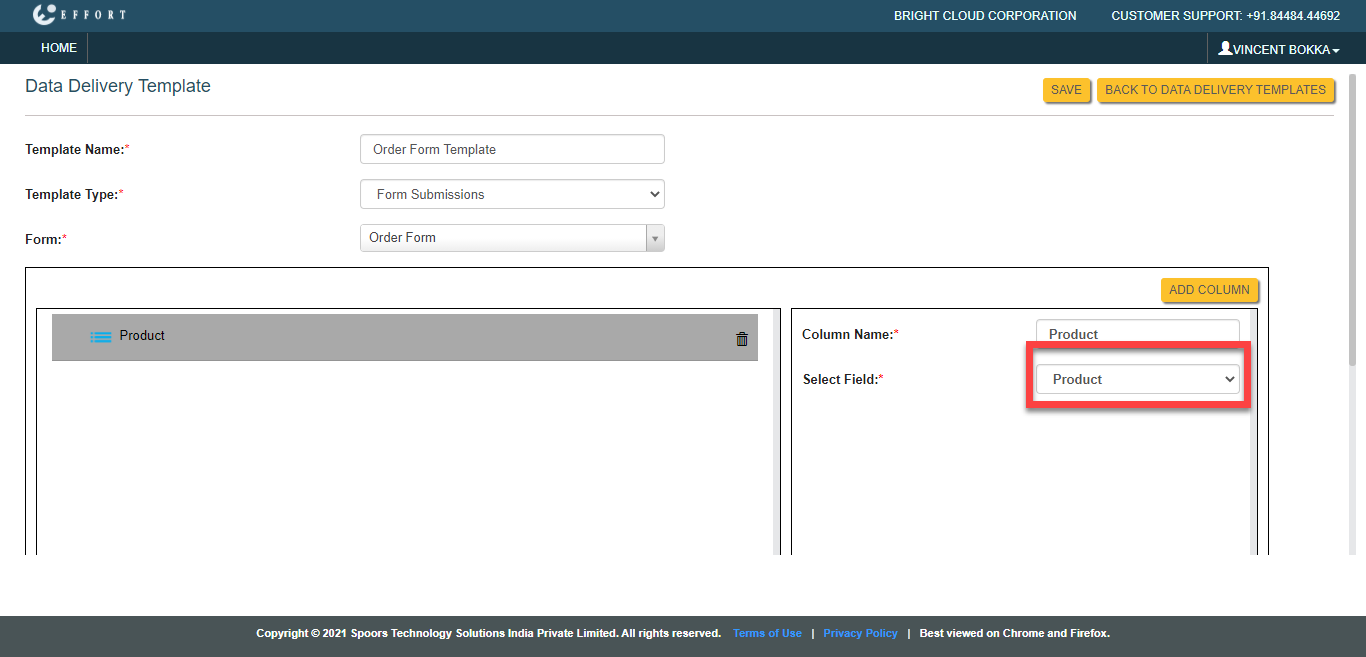
Configure a form field from the Select Field
dropdown.
-
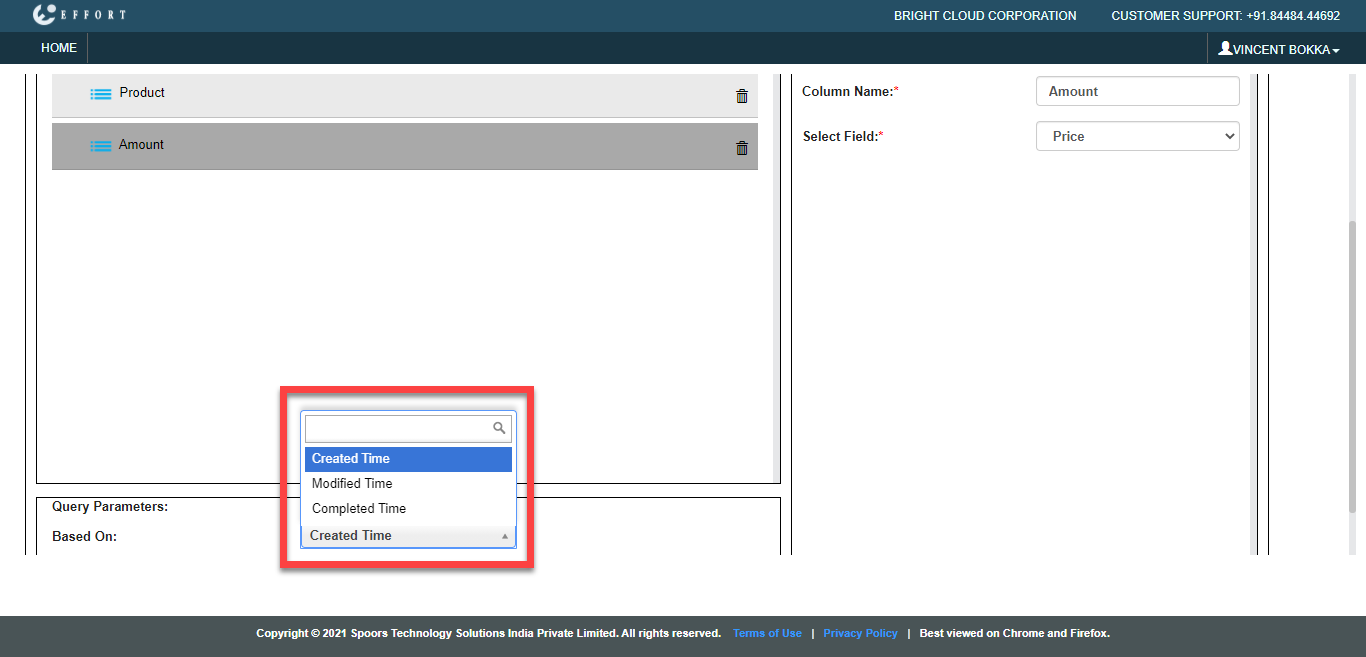
Configure Query Parametrs from the Based
On dropdown.
-
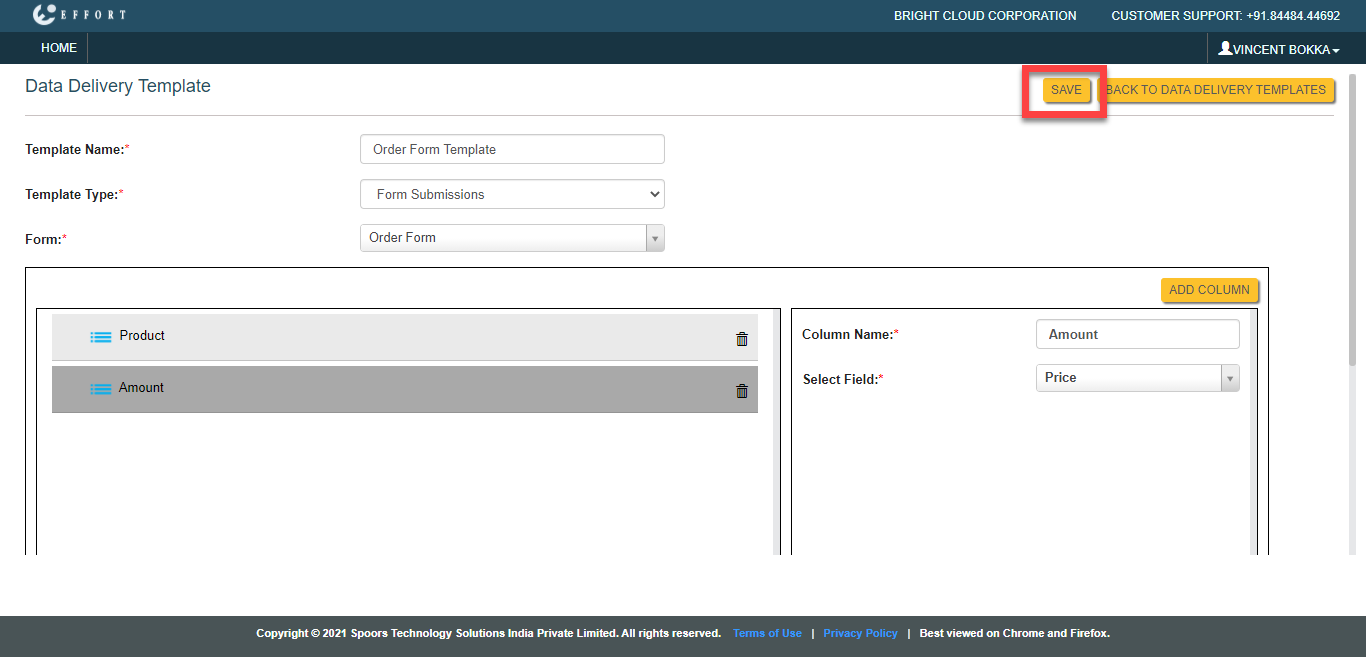
Click Save.
Step 3. Create a Report in Google Data Studio
This section helps you to create a report with the Spoors EFFORT in the Google Data Studio.
- Go to datastudio.google.com and log in with your Google account, if needed.
-
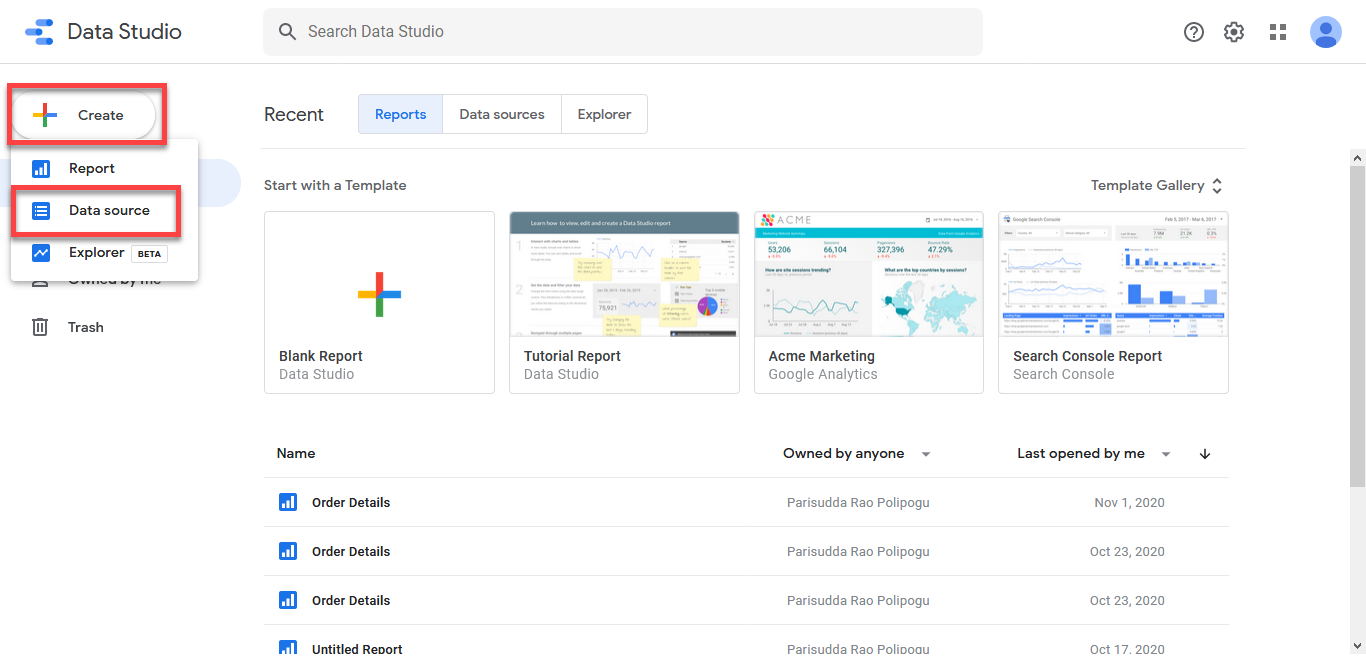
Click Create and select Data
Source to add the sample data source.
-
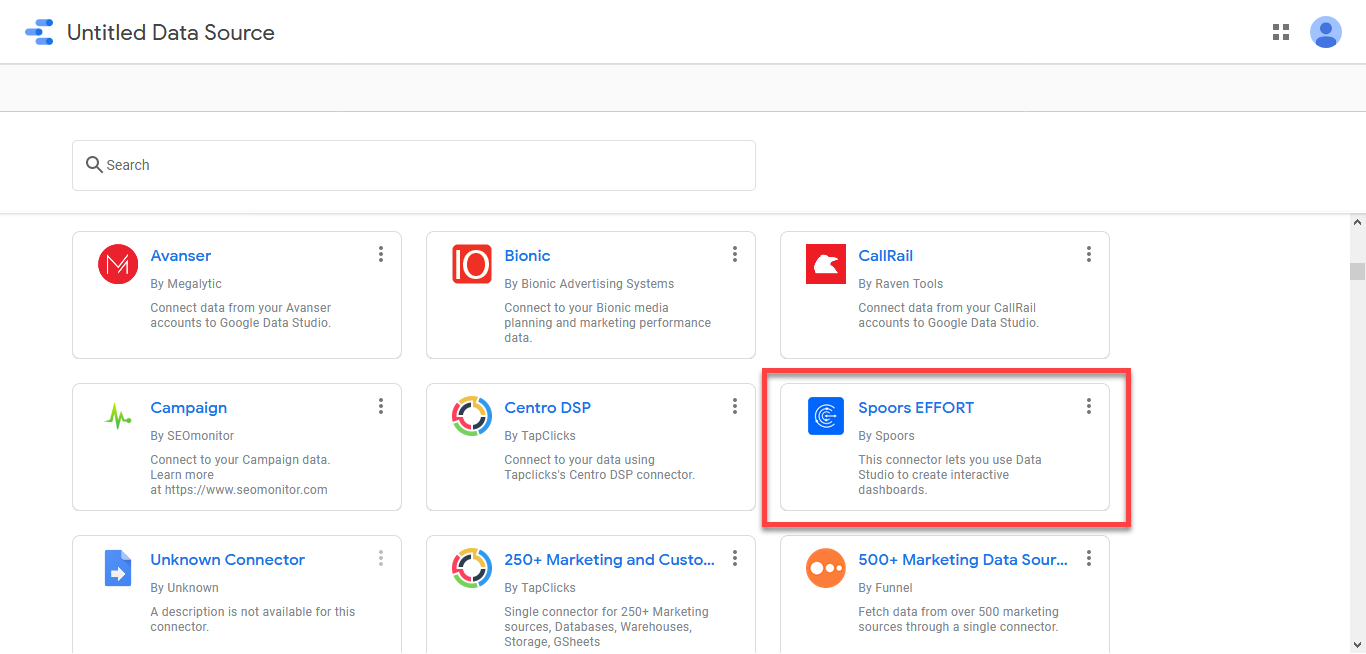
Scroll down to the Partner Connectors section and look for the
Spoors EFFORT connector. Alternatively, you can use the search
bar at the top. Click on the Spoors EFFORT connector.
-
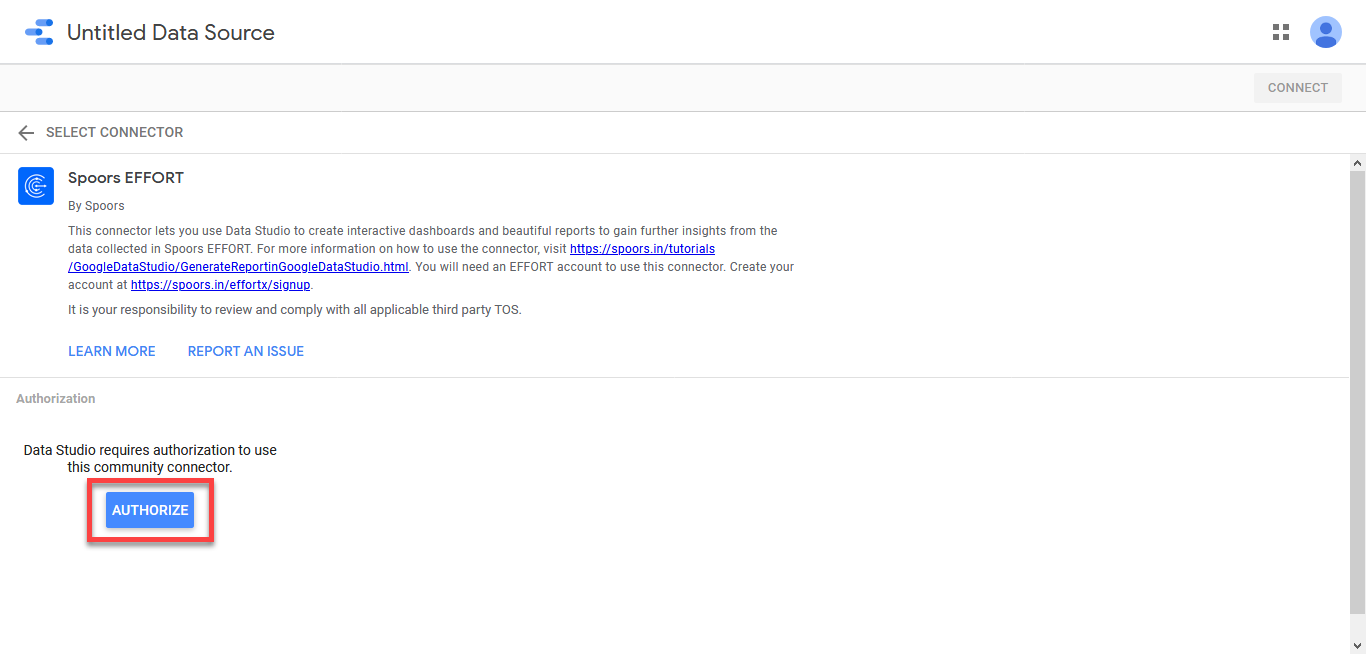
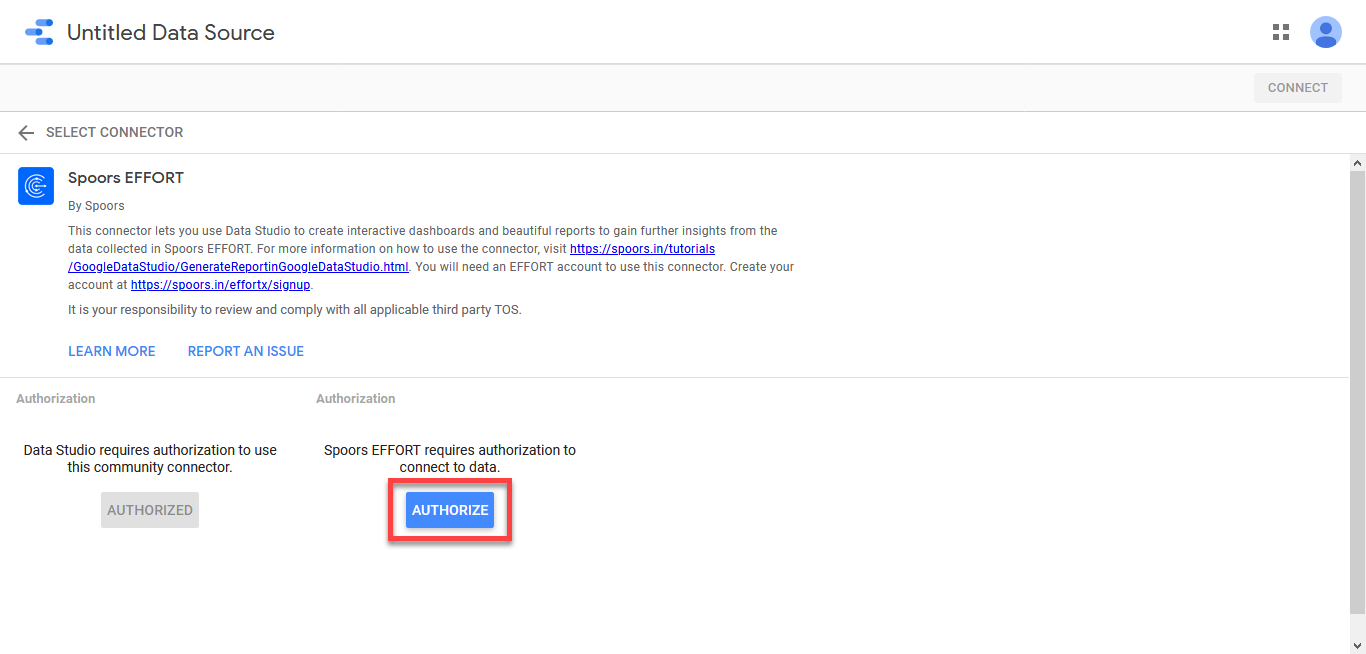
Click on the AUTHORISE button to give permission to the connector to
access your Google account.
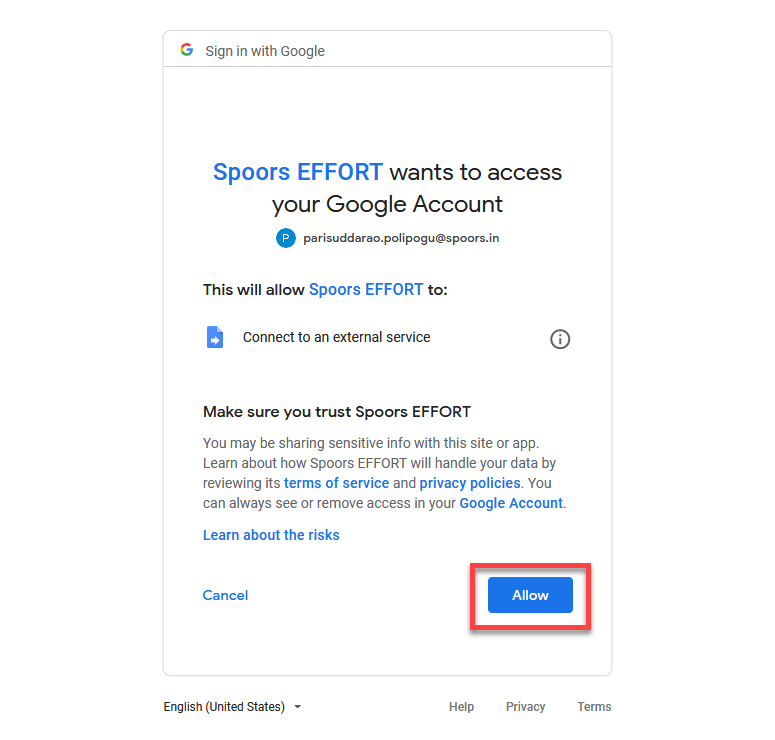
A new Google Sign in pop-up window appears.
-
Select the same account you use Data Studio with and click on Allow
to accept the access request.
-
Click on the second AUTHORISE button to log in to the data source
itself.
-
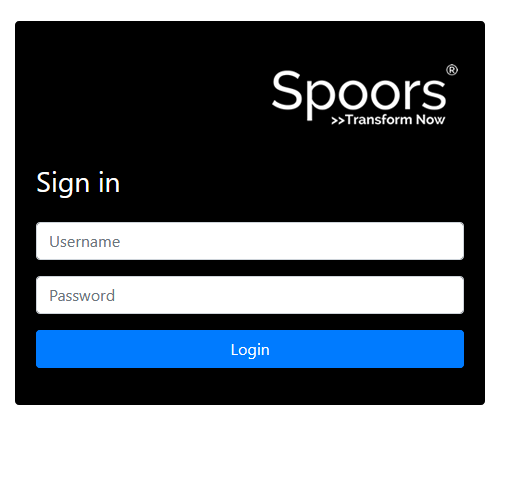
Log in with your Spoors account.
-
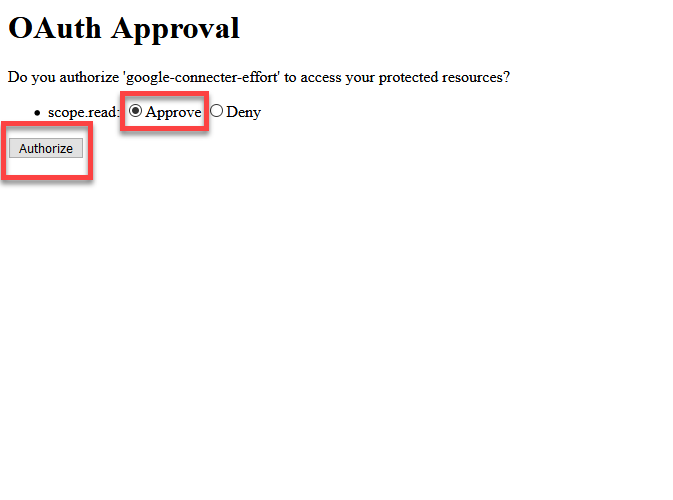
In the OAuth Approval page, select Approve and click
Authorize button.
-
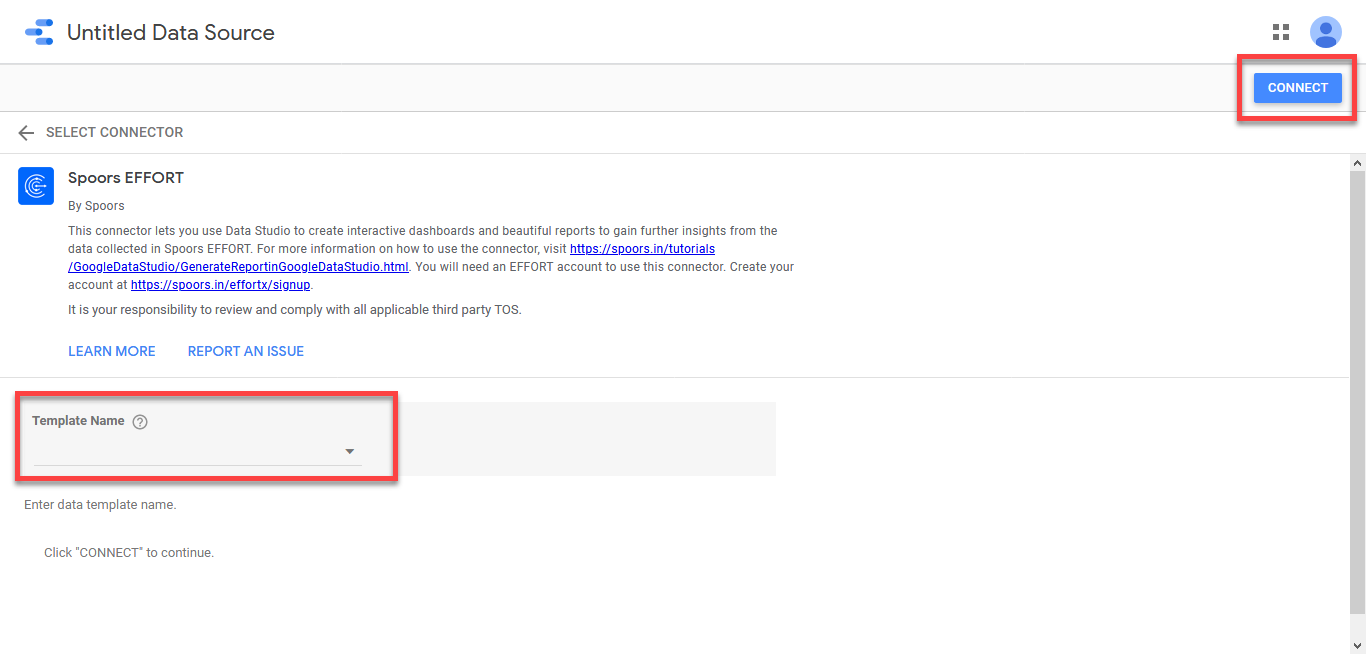
Select a template from the Template Name dropdown
and click Connect button located on the top right
corner.
-
Click Create Report button.
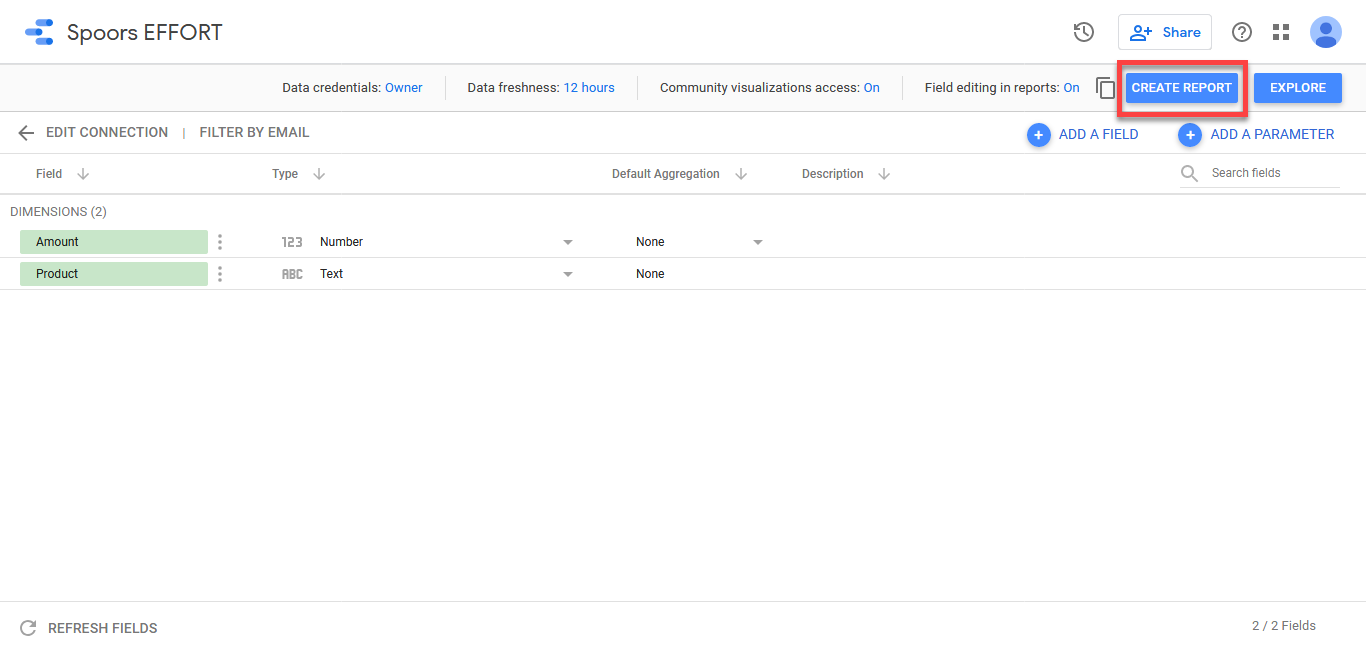
The Untitled Report page appears in a new window.
-
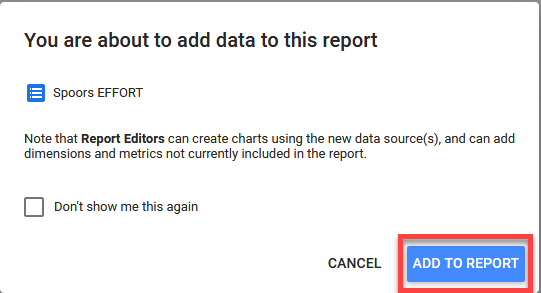
Click Add To Report in the report pop-up.
-
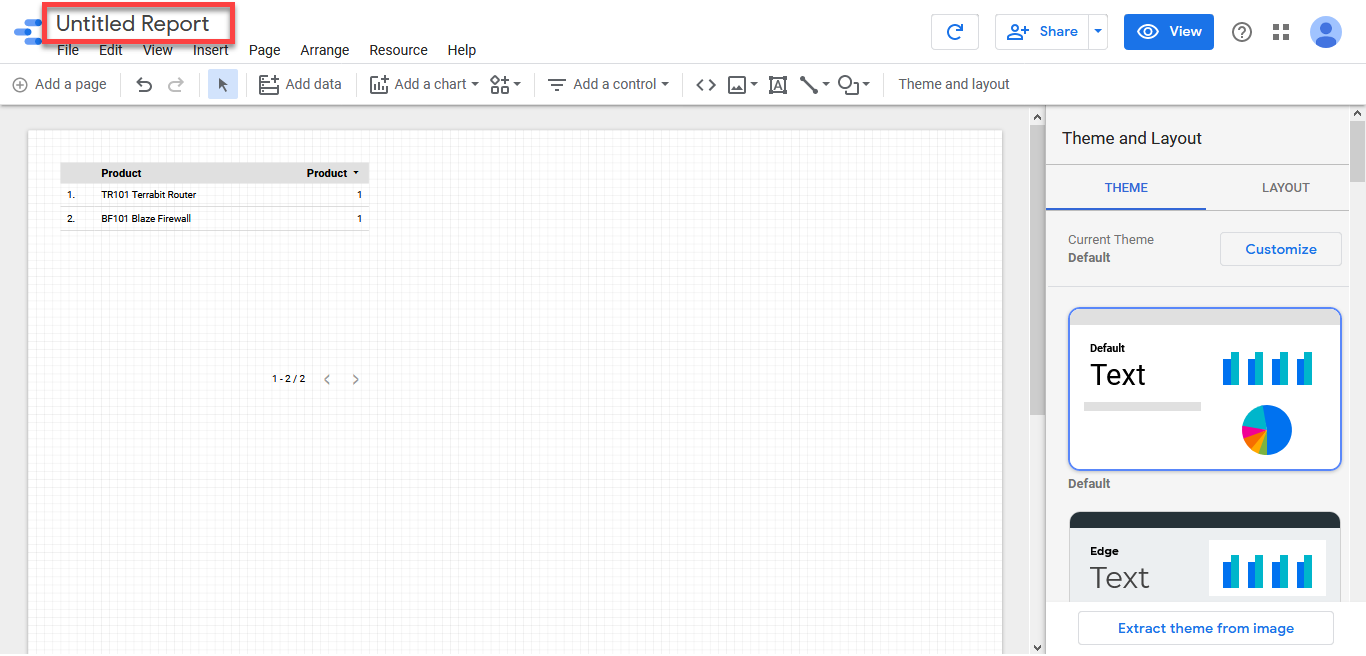
Enter a title for the report in the Untitled Report
field.
-
Create report as per your requirement.
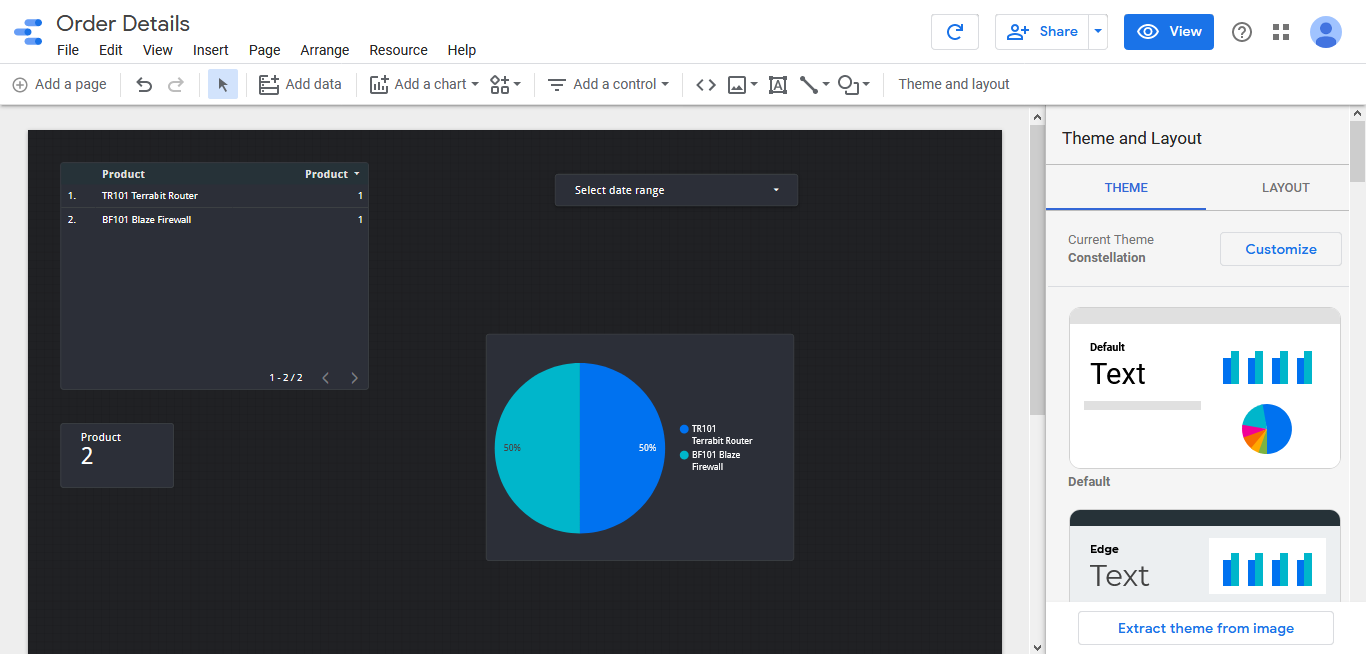
Data Studio provides 15 visual elements:- Time series
- Bar chart
- Pie chart
- Geographic map
- Data profile
- Scatter chart
- Bar chart
- Area chart
- Text
- Picture
- Rectangle
- Circle
- Date range
- Filters
-
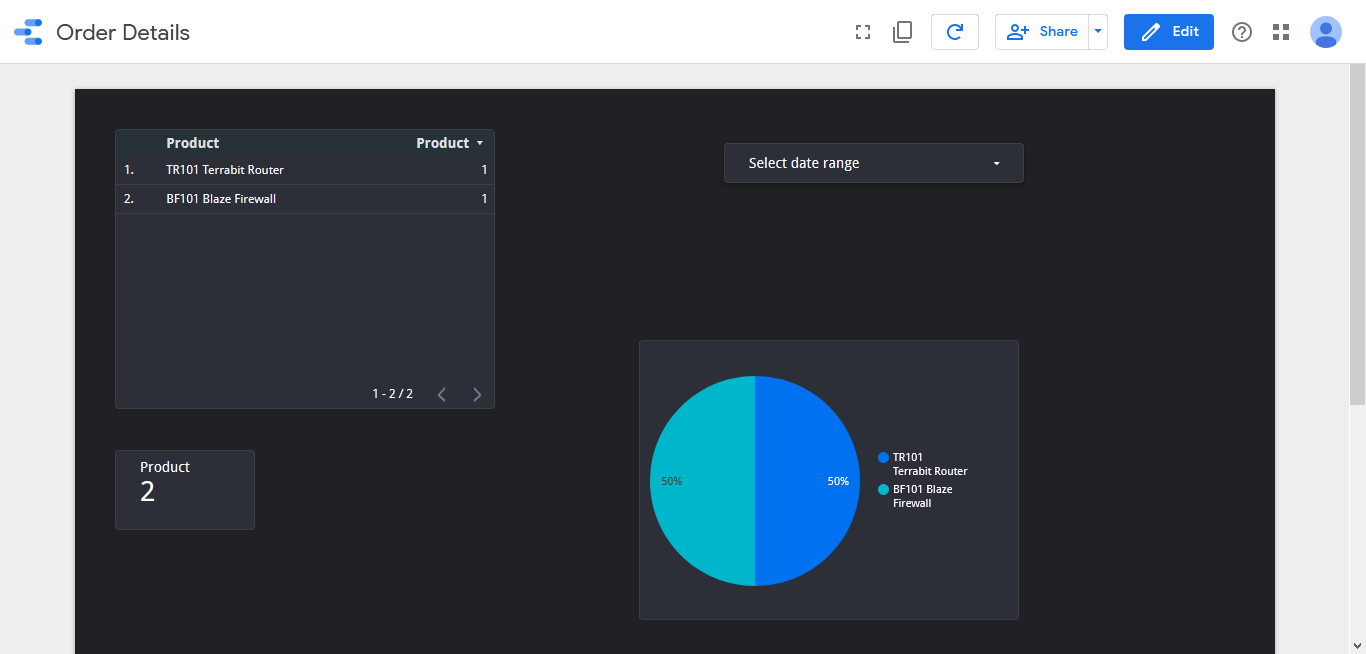
If you want to scope out what your report really looks like, click the
View button. This removes the helpful design grid
and the rest of the UI elements. It brings your visualization to the
foreground.
-
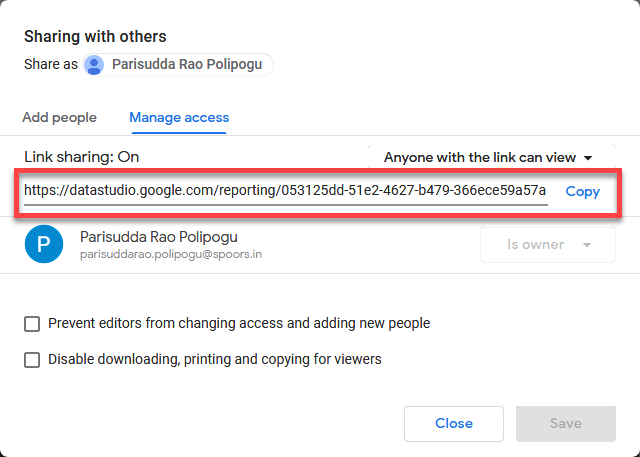
Click Share button on the top of the page to generate a shareable
link. Enable link sharing as per your requirement and click
Save.
-
Copy the link and paste in the web browser to view the report.